
Why the Same Online Slot Can Have Different RTPs

Two identical games, two different numbers
The scenario below is hypothetical. It describes no specific game, operator or player.
A reader opens the same slot on two licensed sites in an evening. The artwork is identical: the same reels, the same symbols, the same bonus round introduced by the same animation. The paytable lists the same prize for five of the top symbol. On the first site, the game-information screen states a theoretical return to player of 96.5 per cent. On the second, the same screen says 94.5 per cent.

The natural assumption is that something is wrong: a typo, a bug, or a site that has tampered with the game. In regulated markets, none of those is the most likely explanation. The more probable one is that the two sites are running two different, separately tested mathematical configurations of a game that looks the same on screen.
That distinction — between a game's presentation and its probability model — is the subject of this article. The presentation is what a player sees and interacts with. The model is a specification of which outcomes can occur and how often. Two products can share the first while differing in the second, and the difference is real, measurable and, in Great Britain, required to be disclosed. It is also much less informative about any individual session than the precision of a figure like "94.5 per cent" suggests.
Part I — What RTP actually measures
Return to player is an expected value: a probability-weighted average of what a game pays back per unit staked.
Suppose a single game round has a finite set of mutually exclusive outcomes. Outcome i occurs with probability pᵢ and pays mᵢ times the stake, where the payout is gross — it includes the return of the stake on any winning outcome. Then:
Expected return per unit staked = Σ (probability of each outcome × payout multiplier for that outcome) = Σ pᵢ mᵢ
The probabilities must sum to 1, because exactly one outcome occurs. If this sum equals 0.96, the game's theoretical RTP is 96 per cent. The house edge is the complement: 1 − 0.96 = 0.04, or 4 per cent. Expressed in money, the expected net result for the player is −4p for every £1 staked.
Real slots have thousands or millions of distinct outcome combinations, plus bonus rounds that are themselves sequences of random events, so the calculation is carried out by enumeration or simulation rather than by hand. The principle is unchanged.
Several terms are often confused, and the distinctions matter for everything that follows.
Theoretical RTP is the designed figure produced by the calculation above. It is a property of the probability model and does not depend on anyone playing.
Observed RTP (the Gambling Commission calls it actual RTP) is total winnings divided by total stakes over some period of real play. It will differ from the theoretical figure, sometimes greatly, and converges towards it only as the volume of play becomes very large.
Individual outcomes are single draws from the distribution. A given spin might pay 0, 1, 2 or 500 times the stake. None of these is "96 per cent".
Long-run expectation is the average that observed RTP tends towards over an enormous number of independent rounds, summed across all players.
The consequence is the point most often missed. A 96 per cent RTP does not mean that a player who stakes £100 will get roughly £96 back. It means that the average return, across a very large number of rounds, is 96 per cent of the amount staked. An individual over a short session may finish with nothing, or well ahead. RTP describes the centre of a distribution; it says nothing about how wide that distribution is.
One further detail is worth making explicit. RTP is calculated against turnover — total amount staked, including re-staked winnings — not against the money a player first deposited. A player who deposits £20 and keeps re-staking can generate turnover many times that figure, and the expected loss scales with turnover.
Part II — How one game can carry several mathematical models
If RTP is the sum of probability times payout, there are only two ways to change it: change the payouts, or change the probabilities. Because the paytable is visible to the player and part of the game's identity, alternative configurations usually leave it alone and adjust the probabilities instead.
How that is done depends on the game's architecture, which differs between developers and products. In reel-based designs, each virtual reel is a sequence of symbols — a reel strip — and the random number generator selects stopping positions. Adding or removing occurrences of a high-value symbol on a strip, or changing how random values are mapped onto stop positions, changes the probability of every combination involving it. In other designs, the game may select directly from a weighted table of outcomes and then choose an animation to display it; changing the weights changes the probabilities without any visible difference. Bonus features add further levers: the probability of triggering the feature, the distribution of multipliers or prizes inside it, and the number of free rounds awarded.
These are illustrations of where probability can be adjusted, not a claim about how any particular commercial game is built. The general point holds across architectures: the screen shows outcomes, not their probabilities. Two configurations can display identical symbols, identical paytables and identical animations, and still differ in how frequently the high-paying outcomes occur.
In practice, many game suppliers produce a title in several RTP variants, each tested as a separate configuration, and the operator chooses which variant to offer within the rules of the relevant jurisdiction. Supplier documentation and the game-information screens of regulated sites commonly show figures a percentage point or two apart for the same title. Not every game has multiple versions, and not every supplier offers them. Where they exist, they are best understood not as a single game with a dial, but as distinct mathematical products sharing a common presentation.
Commercial context helps explain why the practice has become more visible. Operators' margins depend on the house edge, and in Great Britain the tax on online casino profits — Remote Gaming Duty — rose from 21 to 40 per cent on 1 April 2026. Trade coverage since then has reported operators choosing lower-RTP configurations of some titles. That is a business decision taken within regulatory limits, and it does not by itself imply anything improper. It does make the question of which version is running more consequential.
Part III — A worked model: same paytable, different returns
The model below is fictional and educational. It is deliberately simplified and does not represent any commercial slot.
Imagine a game in which each round, at a stake of one unit, produces exactly one of six mutually exclusive outcomes. Payouts are gross multiples of the stake: a payout of 2 means the player receives two units back, a net gain of one. A payout of 1 returns the stake, a net result of zero. A payout of 0 is a loss of the stake.
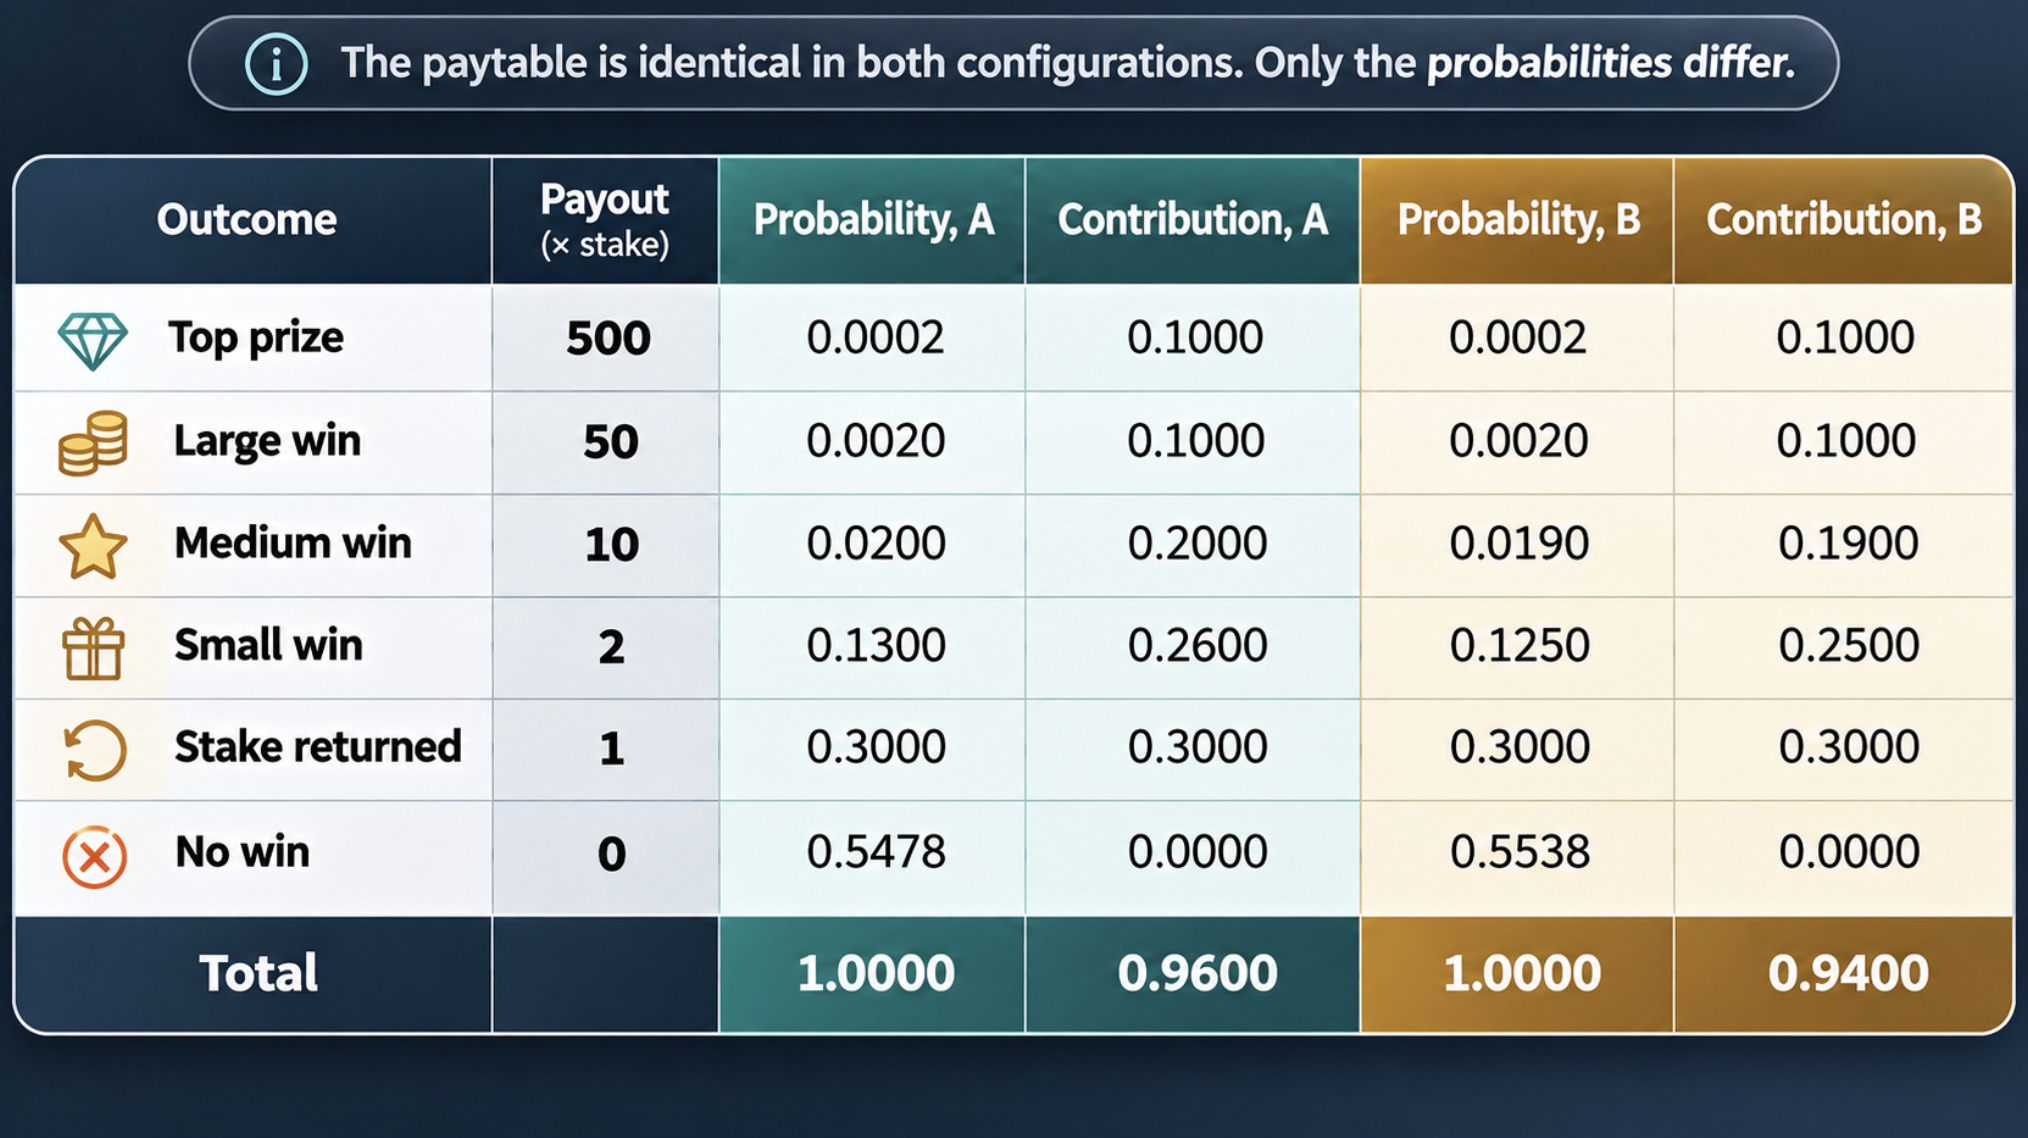
Each contribution is probability multiplied by payout. For configuration A, the medium win contributes 0.02 × 10 = 0.20, and the small win 0.13 × 2 = 0.26. Adding the column gives 0.10 + 0.10 + 0.20 + 0.26 + 0.30 = 0.96.
The probabilities also sum correctly: 0.0002 + 0.002 + 0.02 + 0.13 + 0.30 = 0.4522, so the probability of no win is 1 − 0.4522 = 0.5478.
Configuration B makes two small changes. Medium wins become slightly rarer (0.019 instead of 0.02) and small wins slightly rarer (0.125 instead of 0.13). The probability removed from those outcomes moves to "no win", which rises to 1 − 0.4462 = 0.5538. The expected return is 0.10 + 0.10 + 0.19 + 0.25 + 0.30 = 0.94.
The results:
Configuration A: RTP 96 per cent, house edge 4 per cent, expected net loss 0.04 units per unit staked.
Configuration B: RTP 94 per cent, house edge 6 per cent, expected net loss 0.06 units per unit staked.
Three observations follow. First, nothing visible changed. The prizes, symbols and paytable are the same; a player looking at the screen would have no way to tell the configurations apart without the game-information panel.
Second, the differences are small at the level of a single round. Medium wins fall from 1 in 50 rounds to roughly 1 in 53; small wins from 1 in 7.7 to 1 in 8. No player could detect this by experience.
Third, the house edge rises by half — from 4 to 6 per cent — even though the probabilities changed by a fraction of a percentage point. Small changes to the frequency of common outcomes can move the expected return more than large-looking changes to rare jackpots, because RTP weights every outcome by how often it occurs. That is precisely why visible similarity is no guide to mathematical equivalence.
Part IV — RTP is not volatility
RTP tells you the centre of the outcome distribution. It says nothing about its shape. That shape is what players actually experience, and it is governed by different quantities.
Variance measures how spread out the outcomes of a single round are around the mean: Var(X) = E[X²] − (E[X])². Standard deviation is its square root, expressed in the same units as the stake. Hit frequency is the proportion of rounds that return anything at all. "Volatility" is the industry's informal label for the combination: how often a game pays, and how much of its return is concentrated in rare, large prizes.
In the fictional model from Part III, configuration A has E[X²] = 0.0002 × 500² + 0.002 × 50² + 0.02 × 10² + 0.13 × 2² + 0.30 × 1² = 50 + 5 + 2 + 0.52 + 0.30 = 57.82. Its variance is 57.82 − 0.96² ≈ 56.90 and its standard deviation about 7.54 units per round — nearly eight times the stake, almost all of it from the top prize. Configuration B's standard deviation is almost identical, about 7.54. Changing the RTP by two points barely changed the volatility. The two properties are separable.
Two games, one RTP, very different sessions
A second fictional illustration.
Consider two games, both with a theoretical RTP of exactly 96 per cent.
Game L pays 1.2 times the stake with probability 0.8 and nothing otherwise. Expected return: 0.8 × 1.2 = 0.96. Hit frequency: 80 per cent. Standard deviation: √(0.8 × 1.44 − 0.96²) = √0.2304 = 0.48 units.
Game H pays 960 times the stake with probability 0.001 and nothing otherwise. Expected return: 0.001 × 960 = 0.96. Hit frequency: 0.1 per cent. Standard deviation: √(0.001 × 921,600 − 0.9216) ≈ 30.3 units.
Now consider a session of 200 rounds at one unit each. In both games the expected net loss is the same: 200 × 0.04 = 8 units. The experience is entirely different.
In Game L, the standard deviation of the session total is 0.48 × √200 ≈ 6.8 units. Results cluster fairly tightly around the expected loss. To finish ahead, the player needs at least 167 winning rounds out of 200 (since 1.2 × 167 = 200.4); the number of wins has mean 160 and standard deviation √(200 × 0.8 × 0.2) ≈ 5.66, so this happens roughly one time in eight.
In Game H, the standard deviation of the session total is about 30.3 × √200 ≈ 429 units — more than fifty times the expected loss. The probability of no win at all in 200 rounds is 0.999²⁰⁰ ≈ 0.82. So in roughly 82 per cent of such sessions the player loses all 200 units; in most of the rest, a single prize of 960 units turns the session into a large net gain.
Same RTP, same expected loss — and one game produces a steady small drain, the other mostly total losses punctuated by rare large wins. Neither profile is "better" in any objective sense, and neither can be used to predict the next round: each round is independent, and a long run without a win in Game H does not make the next win any more likely. Volatility describes the spread of possible results. It does not forecast which of them will occur.
Part V — What a random number generator does, and what it does not
It is common to describe slots as "controlled by the RNG", as if the random number generator decided how generous a game is. It does not. Two distinct components are involved.
The random number generator produces a stream of numbers that are, for practical purposes, unpredictable and uniformly distributed over some range. In online gaming this is usually a software algorithm, seeded and implemented so that its output cannot feasibly be predicted.
The mapping — what the Gambling Commission's standards call scaling — converts each random number into a game outcome. A number between 1 and some large maximum is translated into reel stops, a card, or a row in an outcome table, according to the probabilities specified by the game's mathematical model. The RNG supplies uniformity; the mapping supplies the weighting. In configuration A and configuration B from Part III, the RNG could be identical. Only the mapping differs.
This is why a perfectly certified RNG says nothing about the RTP. A fair coin and a coin-toss game that pays 1.9 times the stake on heads use the same randomness and have very different expected returns.
In Great Britain, the Commission's Remote gambling and software technical standards (RTS 7) address both halves. Random number generation and game results must be "acceptably random" — demonstrable to a high degree of confidence through generally accepted statistical tests. The implementation guidance expects the RNG's output to be uniformly distributed and unpredictable, without repeating cycles or synchronised instances, and expects any scaling to preserve those qualities. It also requires that game outcomes be distributed in accordance with the theoretical probabilities, and that the mapping from random inputs to outcomes follows the prevailing probabilities and paytables.
Two further provisions bear directly on this article's question. First, adaptive behaviour is prohibited: a game may not adjust its probabilities during play in response to results — it cannot become more generous after a losing run, or less generous after a win. Random numbers must be used in the order received and may not be discarded to steer outcomes. Second, rules, payouts and outcome probabilities may not be changed while a game is available for play, except as the game's rules describe; changes must be made with the game offline, and customers must be notified.
The practical implication is that an RTP configuration is fixed for a given game instance. A player is not facing a game that adjusts its generosity from spin to spin. They are facing a fixed probability distribution, sampled at random — and that is exactly why the figure on the information screen matters.
What certification cannot do is guarantee any particular player a return. A correctly functioning RNG and a correctly implemented mapping will, by design, produce long losing sequences and occasional large wins in the proportions the model specifies. Randomness that has been verified is still randomness.
Part VI — Regulation, certification and disclosure
Great Britain
In Great Britain, the Gambling Commission sets technical standards for remote gambling and gambling software under sections 89 and 97 of the Gambling Act 2005, and licence conditions require compliance. Several elements bear on RTP.
Disclosure. RTS 3 requires that information enabling a customer to make an informed decision about their chances of winning be easily available before they commit to gamble. For each game it must include a description of how the game works and how winners are determined, and one of: the house edge, the RTP percentage, or the probability of winning events. For slots, this is ordinarily the average theoretical RTP shown in the game's help or information screen. The standard is about the game as offered: where several configurations exist, the figure a customer sees should describe the one they are playing. Where a progressive jackpot is involved, RTS 9 allows the RTP to be shown either combined or split into base game and jackpot components.
Testing. The Commission maintains a list of approved test houses. Games and RNGs must be tested before release under the Commission's testing strategy, and licensees submit test results to the Commission. An alternative RTP configuration is, in mathematical terms, a different probability model, and it is the configuration — not just the artwork — whose behaviour testing must establish.
Change control and audit. Licensees that produce and update games must commission an annual games testing audit from an approved test house, covering among other things change-control procedures and the list of games available to consumers.
Live RTP monitoring. Since September 2016, remote operators have been required to monitor the performance of the games they offer, comparing actual RTP with the theoretical figure and investigating deviations beyond statistically defined tolerances. Responsibility may sit with the supplier that holds aggregated transaction data, but contracts must make clear who performs it. The Commission's own guidance acknowledges the statistical reality discussed in Part VII: actual RTP should approach the theoretical figure only as volume of play accumulates.
Product design and stake limits. Separate rules shape how slots are played, independently of their mathematics. Since 2021 the RTS have prohibited autoplay and features that speed up play on online slots, set a minimum game-cycle speed, and banned celebrating returns that are equal to or less than the stake. Since April 2025, a statutory limit caps the stake per game cycle on online slots at £5 for customers aged 25 and over, and since May 2025 at £2 for those aged 18 to 24. These rules affect turnover and session dynamics; they do not set or limit RTP.
The Commission does not, in its published technical standards, prescribe a minimum RTP for online slots. Which configuration an operator offers is a commercial choice, constrained by testing, disclosure and monitoring rather than by a numerical floor.
Elsewhere
Other jurisdictions take different approaches, and it would be wrong to generalise from Great Britain. Some regulators set minimum theoretical returns for particular product types; Western Australia's gaming commission, for instance, requires electronic gaming machines at its casino to be certified to a minimum 90 per cent RTP, a land-based rule that does not apply to online play. Disclosure requirements also vary: some markets require RTP to be displayed in-game, others only in documentation. A configuration available in one market may not be permitted in another, which is one reason suppliers maintain several versions. Readers comparing figures across borders should assume that the rules behind them differ unless they have checked.
Part VII — What a two-point difference means
The figures in this section are hypothetical and are not claimed to apply to any particular game.
Compare two configurations with theoretical RTPs of 96 and 94 per cent. Per pound staked, the expected net loss is 4p in the first and 6p in the second. The difference sounds small. Proportionally it is not: the expected cost of play is 50 per cent higher in the second configuration.
Over a hypothetical £1,000 of turnover — for instance, 1,000 rounds at £1 each, including re-staked winnings — the expected loss is £40 at 96 per cent and £60 at 94 per cent. Those are statements about the average across a very large number of such sessions. They are not forecasts of what any one session will produce.
The reason is variance. Using the fictional model from Part III, where the standard deviation is about 7.54 units per round, the standard deviation of the net result over 1,000 rounds is about 7.54 × √1,000 ≈ £238. The £20 difference in expectation is less than a tenth of the typical spread of outcomes. In a session of that length, which configuration was running would be almost impossible to infer from the result.
The same arithmetic shows how slowly observed RTP settles. In that model the standard deviation of the observed RTP over n rounds is roughly 7.54 ÷ √n. After 10,000 rounds that is about 7.5 percentage points; after one million rounds, about 0.75 points. To distinguish a 96 per cent configuration from a 94 per cent one with reasonable confidence from two independent records of play — requiring the gap in means to exceed about two standard deviations of the difference — each record would need on the order of a million rounds. That is far beyond anything an individual player generates, and it is why live RTP monitoring is done by operators and suppliers on aggregated data.
None of this makes the RTP difference meaningless. Across all the stakes placed on a configuration by all its players, the gap is real money, and it determines how much of that turnover is retained. For an individual it describes the price of play, not the outcome. A higher RTP lowers the expected cost; it does not make losses unlikely, and it is not a means of making money. Over any finite period, the most probable result in a game with a house edge is still a net loss.
Stake limits interact with this in a straightforward way. Because expected loss scales with turnover, a cap on the stake per game cycle limits how quickly turnover — and therefore expected loss — can accumulate, whichever configuration is running.
Part VIII — What a player can and cannot infer
The RTP figure is genuinely useful information, provided its limits are clear.
It can reveal the configuration's expected cost. The information screen tells a player which mathematical product they are using. Two sites showing different figures for the same title are offering different products, and the one with the lower figure costs more on average per pound staked.
It cannot reveal what will happen in a session. Short-run results are dominated by variance. A session's outcome is consistent with almost any configuration, and a profitable evening on a lower-RTP version is no evidence that it is "paying well".
It cannot reveal volatility. The same RTP can describe a steady drain or a near-certain loss with rare large wins. Some suppliers publish volatility ratings, but these are qualitative labels, not standardised measures, and they are not required disclosures under the GB standards.
Personal experience cannot verify it. As Part VII showed, an individual's play history is far too short to estimate RTP to within several percentage points. Sites or forums that report "observed RTP" from small samples are reporting noise.
Patterns do not establish predictability. Streaks, clusters of wins, or long dry spells are what independent random outcomes look like. In Great Britain, compensated games that adjust their behaviour in response to results are prohibited; each round is drawn from the same fixed distribution. Previous losses do not make a win more likely, and previous wins do not make a loss more likely.
Regulatory context matters. In Great Britain, the displayed figure is a requirement backed by testing, monitoring and audit. In other markets, the rules behind the figure — and whether one is shown at all — may differ.
There is a meaningful difference between transparency and the illusion of control. Knowing the RTP lets a player understand the price of a product. It does not give them any influence over the outcome. Treating the number as a strategic tool — selecting games, timing sessions or adjusting stakes in the belief that it improves one's chances of finishing ahead — misreads what the number describes.
The same game is not always the same mathematical product
Return to the two screens from the opening, showing 96.5 and 94.5 per cent for a game that looks identical on both. The difference is neither a bug nor, in a regulated market, evidence of manipulation. It is the visible trace of two different probability models sharing one presentation.
A slot is best understood in layers. The presentation — artwork, symbols, paytable, animations — is what players see and remember. The probability model specifies how often each outcome occurs; it alone determines the theoretical return. The random number generator and mapping draw outcomes from that model, fairly and independently, in a way that testing can verify. And variance determines how widely realised results scatter around the expectation over any finite number of rounds.
The RTP figure describes the second layer precisely. It says little about the fourth, which is the layer a player actually lives through in a session. That is why the figure matters as consumer information and misleads when read as a prediction.
The precise conclusion is this: two games that look the same can be different products with different prices, and the game-information screen is the only place a player can tell them apart. What that screen cannot do is tell anyone how their own session will turn out.